Economic Impacts of
New York City’s
Investment in Water Supply
Collaboration with New York City Department of Environmental Protection
Project Summary
More than one billion gallons of clean drinking water is delivered to more than 9 million residents in New York City (NYC) and neighboring communities in New York State every day. This is made possible by NYC Department of Environmental Protection (DEP)’s investments totaling more than $3 billion within the New York City Water Supply System, spanning across a 2000-square-mile watershed.
Despite the grandeur of these investments and unparalleled natural resource supply system, there is currently little research analyzing the economic impacts of these investments and water source protections over time. This project recommends a visualization approach to understanding the relationships between DEP initiatives in the Watershed Protection Program and its returns. The policy selected for analysis is the Land Acquisition Program, whose goal is to acquire fee simple and conservation easement interests to protect environmentally-sensitive land in the NYC watershed.
An interactive, web-based visualization tool is developed to explore trends in and relationships between DEP’s Land Acquisition Program and economic metrics including annual Real Average Salary, Average Employment and number of Establishments in the eight counties within the Water Supply System. Check it out here.
Another area of interest was exploring published research methods used to determine ecosystem service valuation. DEP investments over the years have fostered a healthy watershed, a natural ecosystem that collects and filters precipitation through soil, streams, and into reservoirs. In this way, the DEP has provided an “ecosystem service” to the communities that consume its water. Ecosystem service valuation is a developing area of environmental economics. A robust literature review of available methods was performed and can be accessed below.

Scope
This project focuses on economic analysis of the eight counties within the watersheds. Five are located within the west of Hudson Valley Catskill-Delaware System (Cat-Del System): Delaware, Greene, Schoharie, Sullivan and Ulster counties. Three are in the east of Hudson Valley Croton System: Dutchess, Putnam and Westchester counties. Annual and county level data are aggregated for the periods of year 2000 to 2018 from which comprehensive job and salary data is available through the New York State Department of Labor’s Quarterly Census of Employment and Wage program.
Our Sponsor
New York City
Department of
Environmental Protection
The New York City Department of Environmental Protection is the department of the government of New York City that manages the city's water supply and works to reduce air, noise, and hazardous materials pollution.
Data Sources

NYC
Environmental Protection

Open New York
United States
Census Bureau
U.S Bureau of
Labor Statistics
Technology Stack
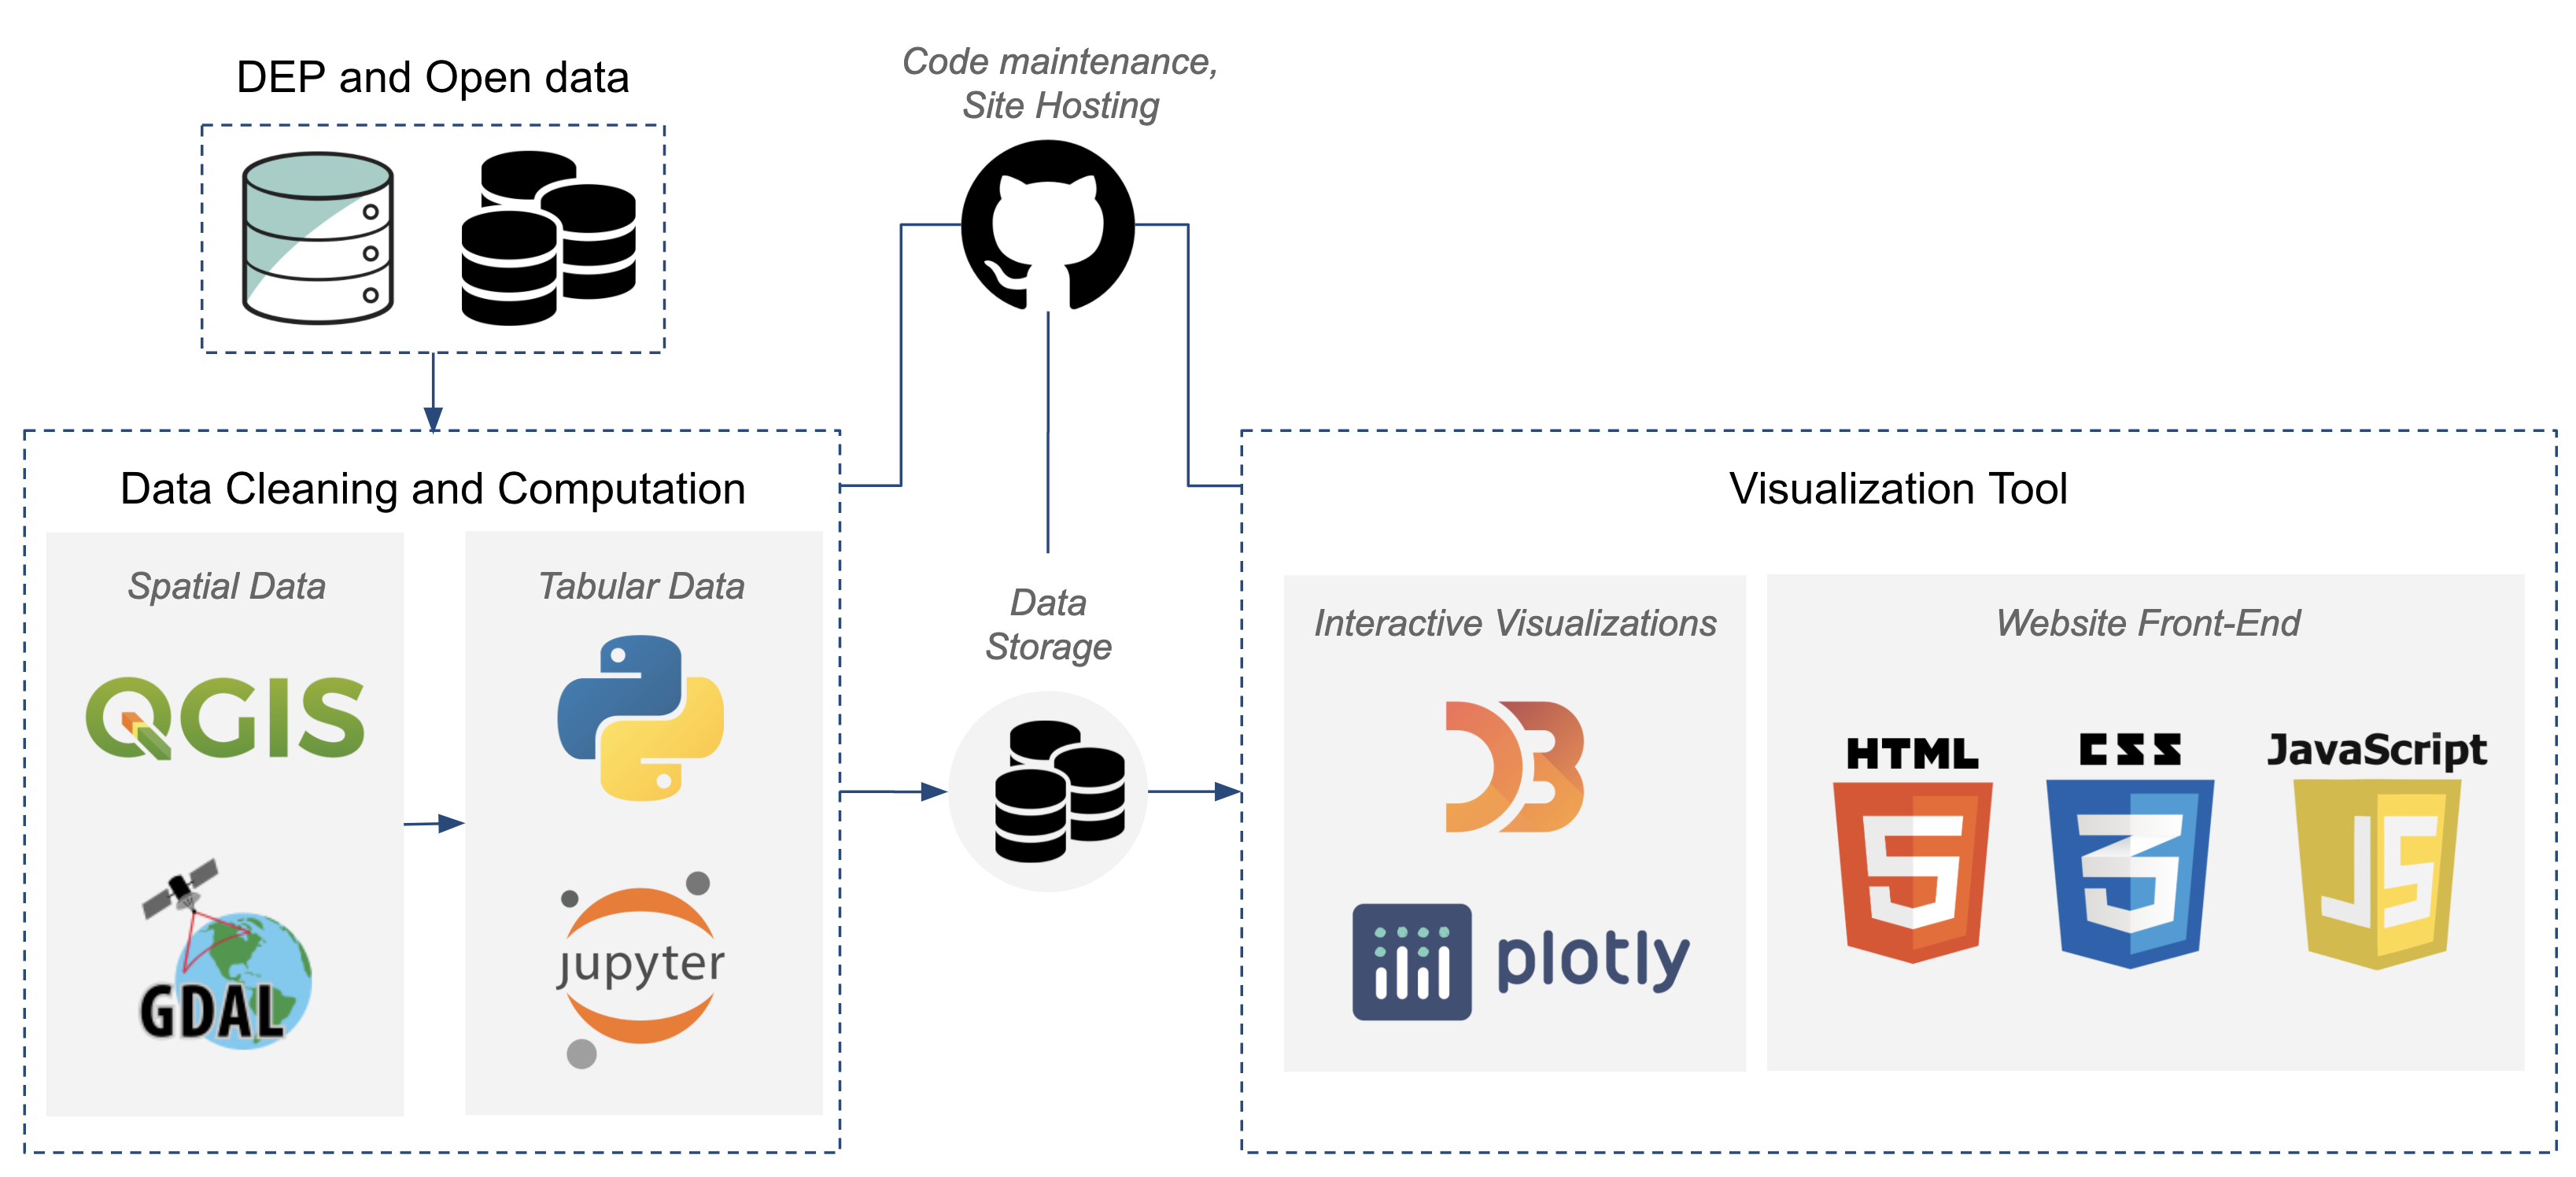
All logos are copyright to their respective owners
Methodology
A data visualization approach was taken to uncover the relationships between DEP’s LAP and the watershed’s employment and wage characteristics. Visualizations were designed and then explored for three areas:
Land acquisition trends for DEP watershed regions in WOH and EOH areas for a 25 year period
Pearson’s Correlation
ρ
(X,Y) =
cov(X,Y)
________
σX.σY
The bivariate Pearson Correlation produces a sample correlation coefficient, r, which measures the strength and direction of linear relationships between pairs of continuous variables. By extension, the Pearson Correlation evaluates whether there is statistical evidence for a linear relationship among the same pairs of variables in the population, represented by a population correlation coefficient, ρ (“rho”). The Pearson Correlation is a parametric measure.
- “SPSS Tutorials: Pearson Correlation.” LibGuides, libguides.library.kent.edu/SPSS/PearsonCorr
To determine whether DEP’s policies and land acquisition have had positive and significant impacts on local communities, the pearson correlation method was adopted. At the county and annual level, the pearson correlation is calculated between each available economic metric for each NAICS industry, and the number of acres DEP has acquired for that specified county. For WOH counties, the number of acres is further broken down to different land use types.
Selected Findings
Margin impact from Land Acquisition
Delaware, whose county area overlaps greatest with the WOH watershed, appears to experience the weak correlations across all metrics and industries. This is surprising especially when compared to strong correlations observed in Putnam, its EOH counterpart and Ulster, the third largest WOH county in terms of watershed coverage.
Read more in Section 3.3
Agriculture, Forestry, Fishing and Hunting
Mixed trends are observed for NAICS Sector 11 Agriculture, Forestry, Fishing and Hunting. Weak correlations were seen for six of the 8 watershed counties. A strong positive correlation is seen in Schoharie while a strong negative one is seen in Ulster. Other industries observe similarly inconclusive correlations.
Read more in Section 4.1
Ulster County
An interesting case study, the Cat-Del System overlaps with 31% of Ulster’s county area. This is modest compared to Delaware (57%) and Putnam (59%). Yet, the correlations between land acquisition and employment trends are some of the strongest compared to the other counties.
Read more in Section 4.2
At a glance
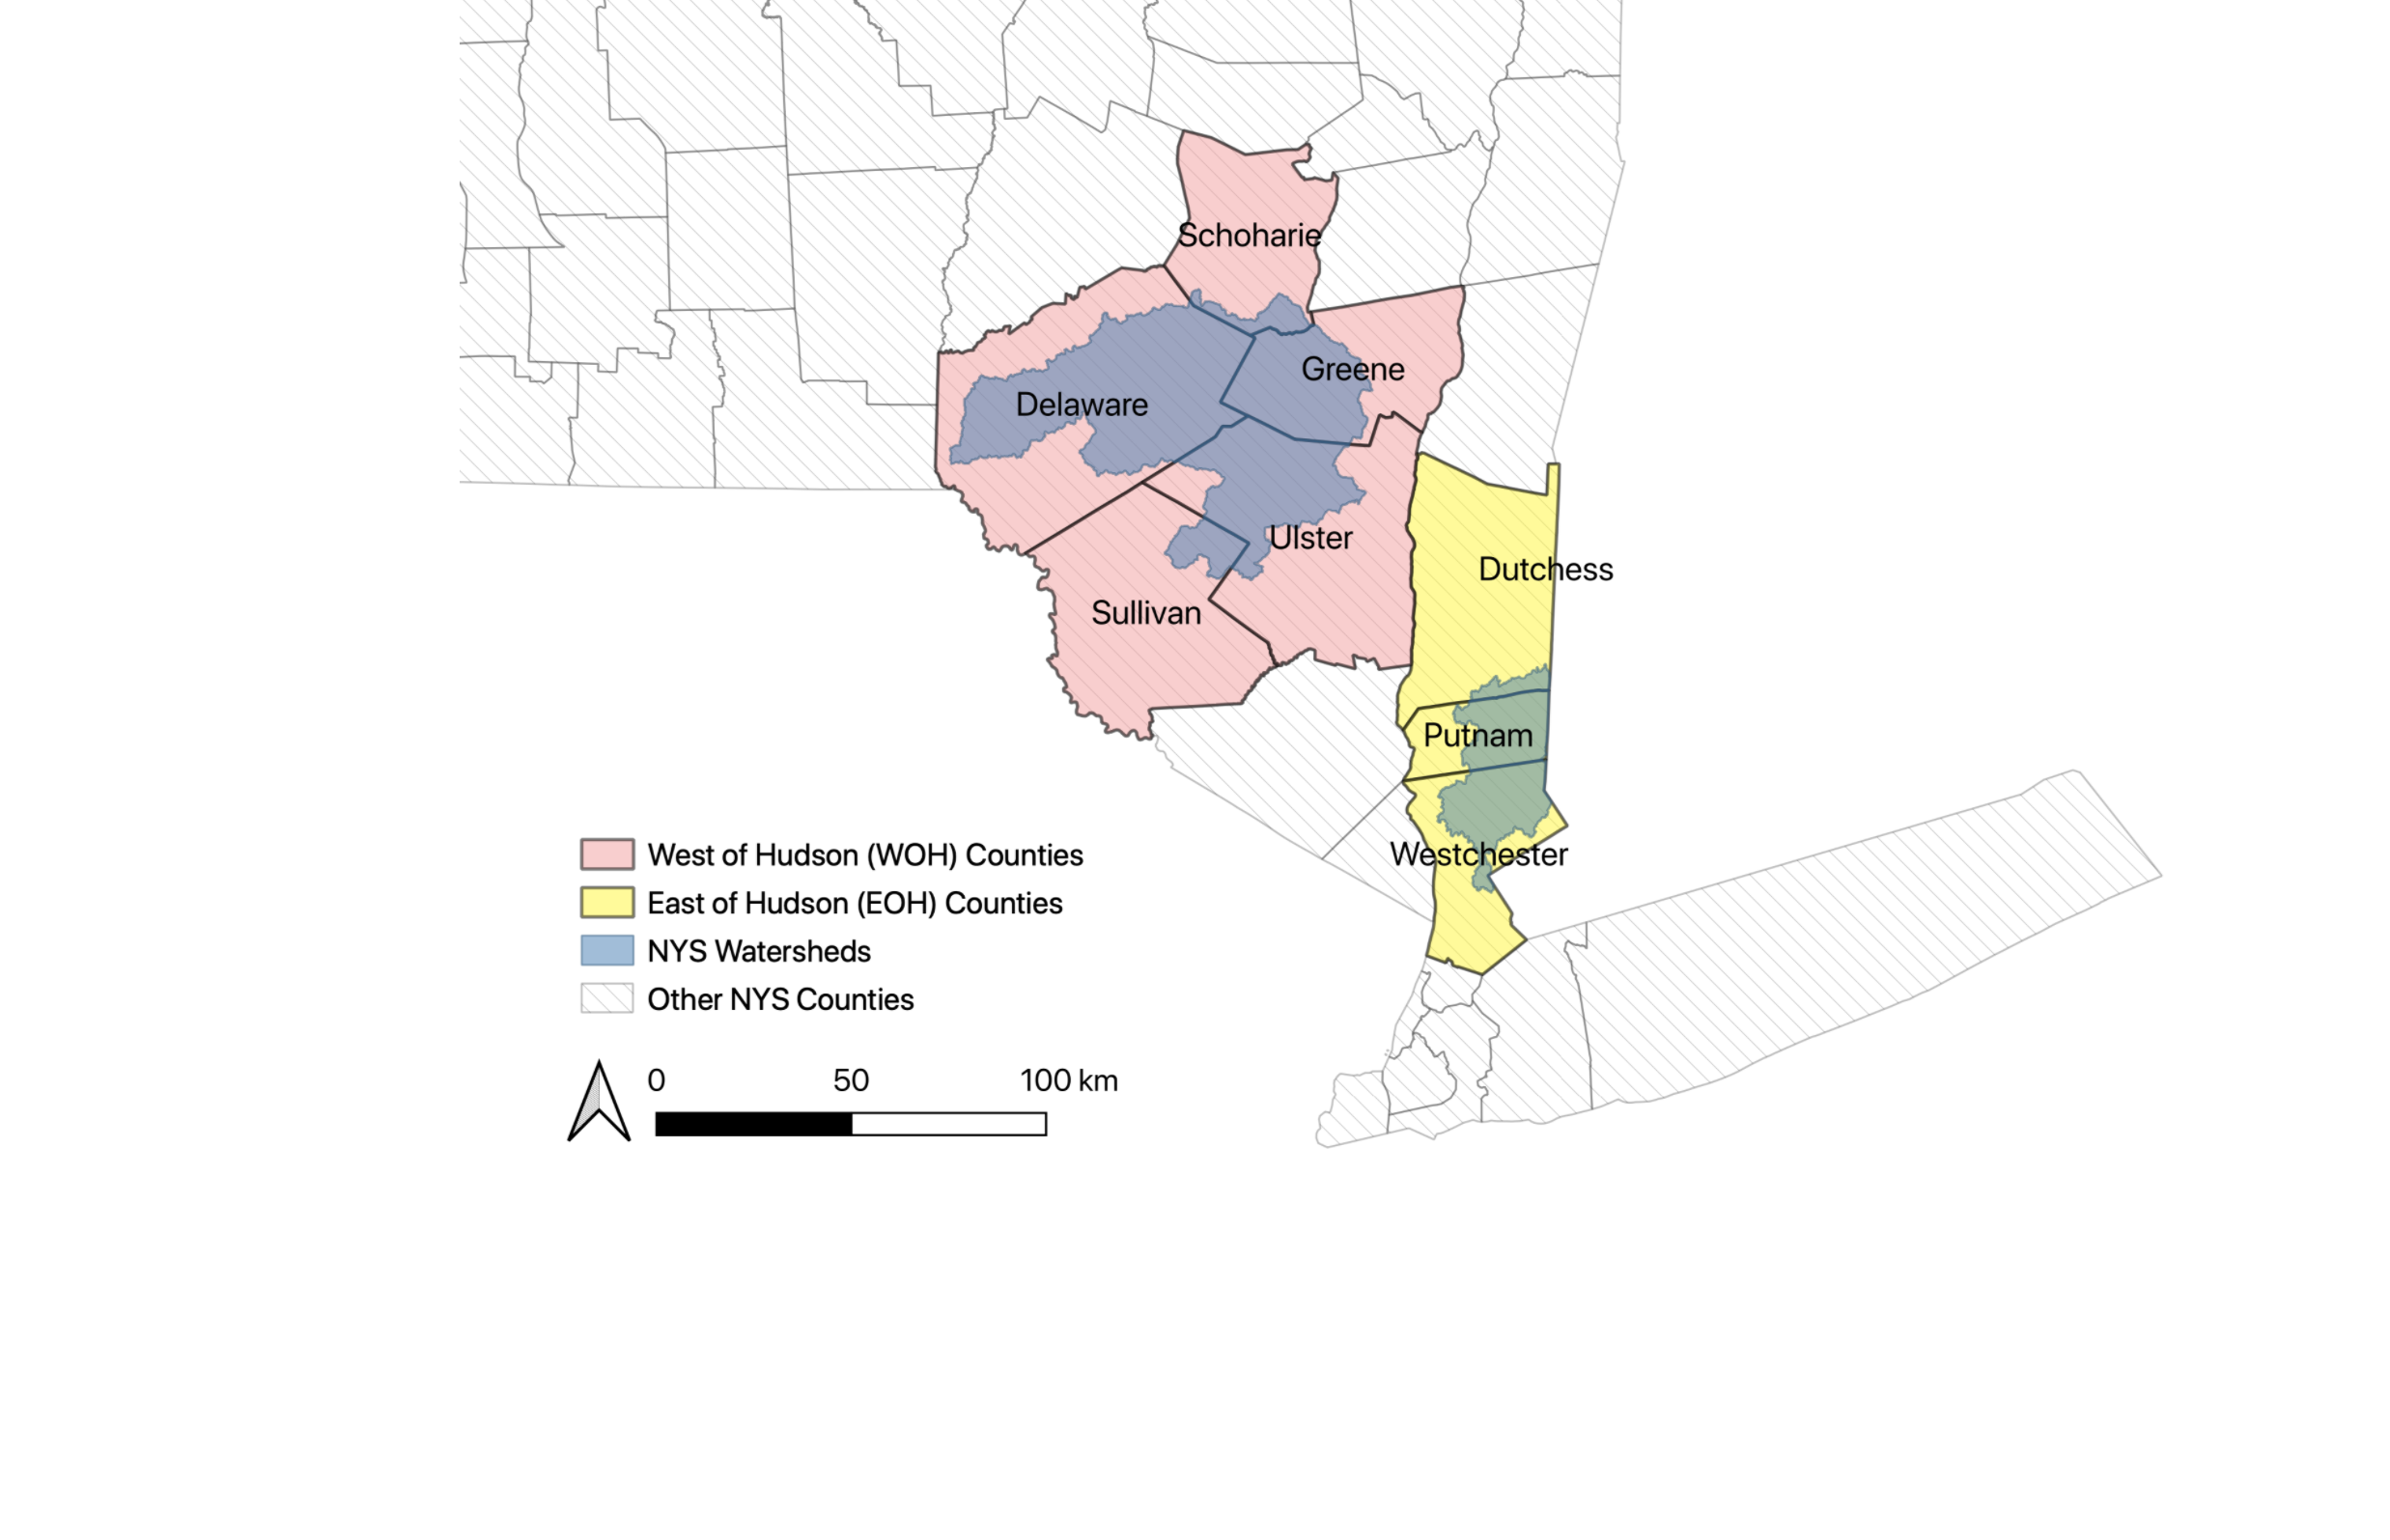
NYC DEP West of Hudson and East of Hudson watershed spatial areas superimposed on county boundaries to visualize spread of the program and impacting areas.
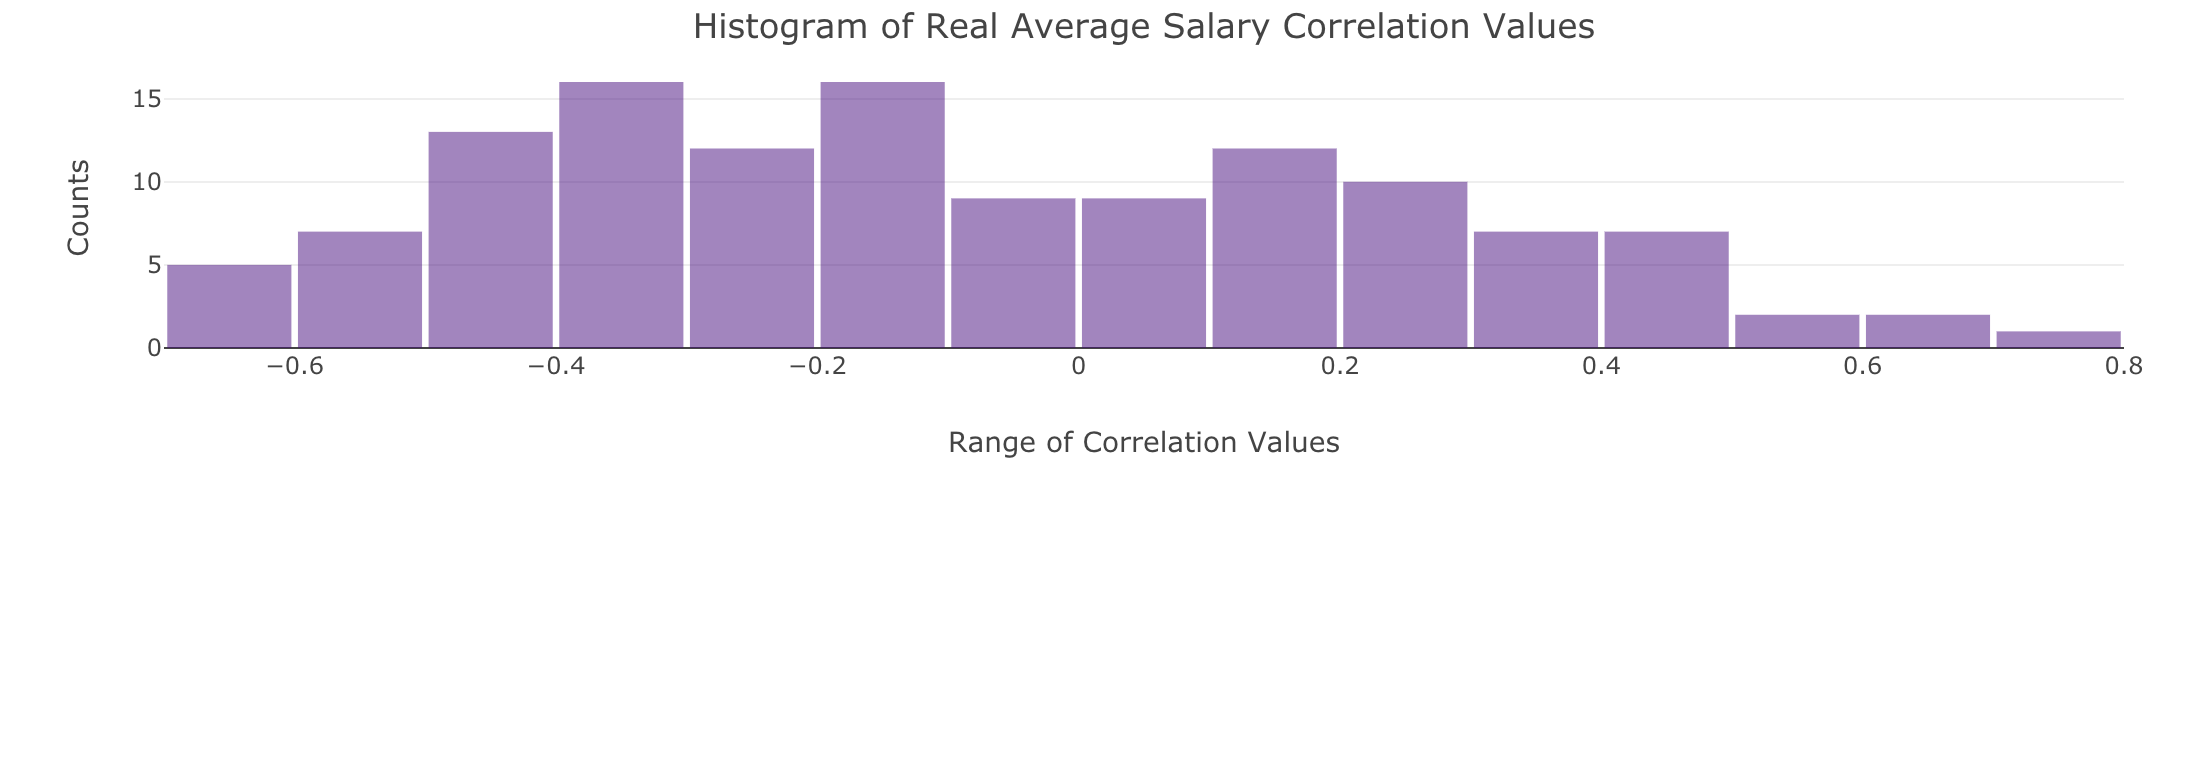
Histogram of correlation values for real average salary across 17 industries and watershed counties, both WOH and EOH inclusive.
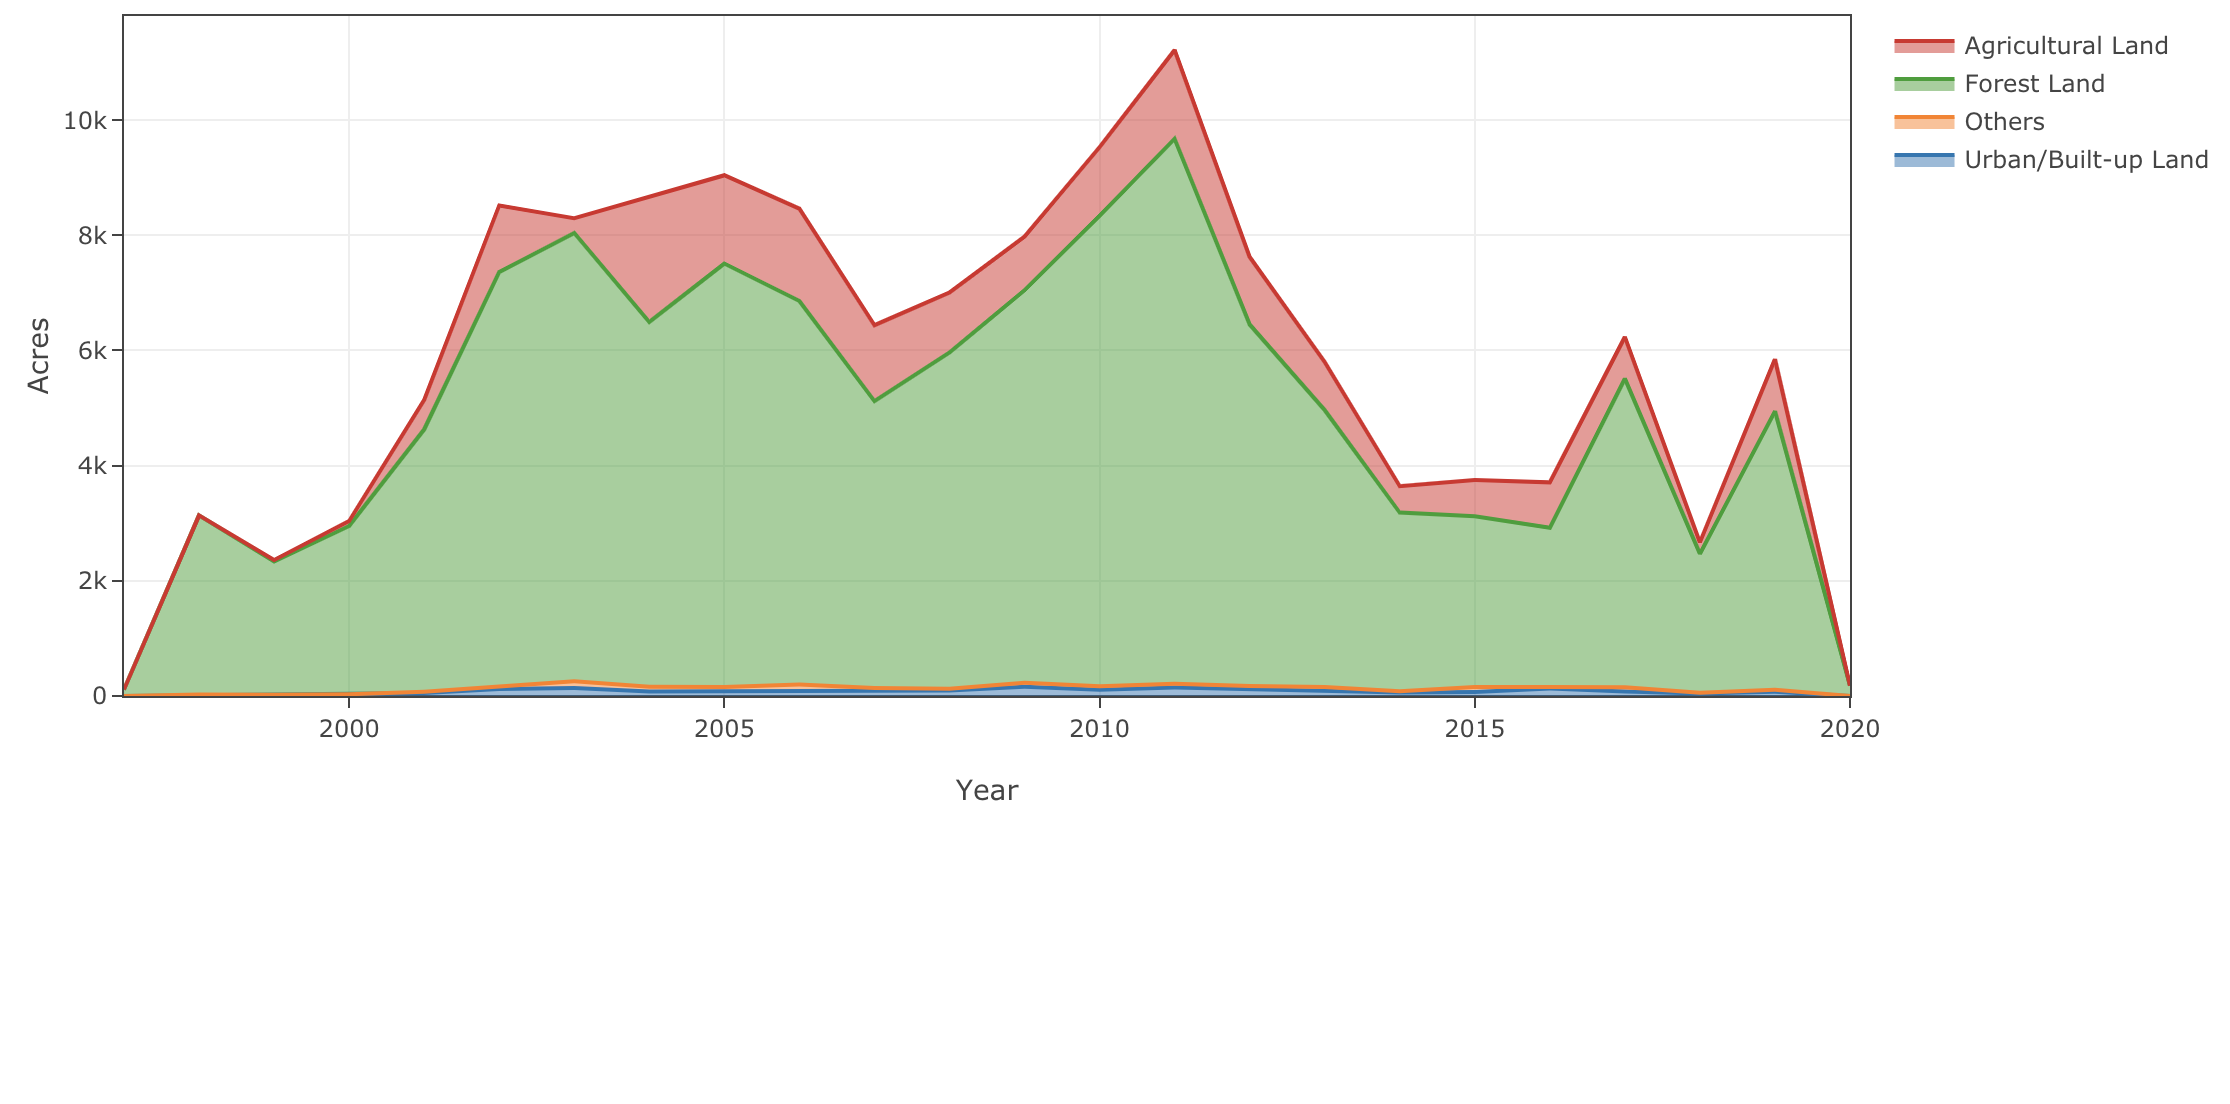
Acres of land acquired by NYC DEP four four different land types over a 25 year period (1995-2020)
Limitations
Low Spatial and Temporal Granularity
The watershed covers different proportions of each county. The percent county area coverage is as high as 59% in Putnam’s and as low as 4% in Dutchess. This disparity should result in differential levels of investments and impacts experienced amongst the counties. However, most openly available financial and economic data exist at either low spatial resolutions (like the QCEW) or low temporal resolutions (like the 5-year ACS estimates). As such, findings remain at a broad descriptive level and should be noted as such.
Intertwining Factors
Mixed trends observed in our economic analysis suggest that more, unknown factors are at play within the watershed economies. For instance, correlations do not account for the 2009 financial crisis, or for other temporary, anomalous events within specific communities of the watershed. A further partnership between experts of the local economy and those from an analytical domain will advance this project.
Future Work
Additional Data Views
Visualization techniques facilitate humans in processing and interpreting large, complex data. Findings across industries, economic metrics, counties and types of land uses would not have been possible in its raw numeric and tabular form. Exploration of the multidimensional data can be furthered by introducing more sorting and filtering features. For example, correlations can be better explored when sorted according to value, rather than by industry.
Data Architecture and Engineering
A next step could involve improving the data pipeline between DEP and the visualisation tool. For instance, creating a user-oriented catalogue of data previews can expedite data sharing and analytical efforts within the agency. This enables the agency to unlock its deep data resource.